Main mechanical properties of spring materials
(1) Elasticity
Objects deform under the action of an external force. When the object can automatically return to the original size and shape after the removal of external forces, the deformation is called elastic deformation, and the deformation that cannot restore the original size is called plastic deformation. This property of the object is mainly caused by the interaction between the microscopic particles inside the object.
The microscopic particles inside the body are mainly affected by the attraction between positive and negative charges and the repulsion between the same charges. When the repulsive and gravitational forces are in balance, the object behaves as a stable size and shape on a macro scale. When the object is subjected to external force, the balance of the force of the microscopic particles is broken, resulting in relative displacement, and the object is deformed in the macroscopic view. If the deformation is not large, the internal particles of the object can be returned to the original equilibrium position after the removal of the external force, and the deformation is elastic deformation. If the deformation is large, the internal particles of the object have a large displacement, and the external force can not return to the original position after removal, then the plastic deformation is generated, and when excessive plastic deformation occurs, the material will break.
The main index to measure the elasticity of an object is the elastic modulus, its physical meaning is: the amount of stress required when the material produces a unit strain, the unit is MPa. The essence of the elastic modulus is the difficulty of the particles inside the object to leave the equilibrium position, so it only depends on the characteristics of the particle combination inside the object, and the grain size, organizational structure and other characteristics have little influence on it. In this sense, the elastic modulus is a property that is insensitive to structural properties.
According to Hooke’s law, in an ideal elastic body, there is a linear relationship between stress and strain when the strain is not large, and the general expression is
ε = σ/E (2-1)
In the formula
E- positive elastic modulus;
ε- positive strain;
Sigma – normal stress.
The elastic modulus commonly used in engineering, in addition to the positive elastic modulus, which represents the positive strain resistance of materials, and the shear elastic modulus G, which represents the shear strain resistance of materials, is expressed as
G=τ/ gamma (2-2)
In the formula
τ-shear stress: γ-shear strain.
From the point of view of engineering technology, the elastic modulus indicates the ease with which a material can produce elastic deformation. From equations (2-1) and (2-2), it can be seen that the greater the value of E or G, the greater the stress required to generate the unit strain. In other words, the larger the E value or G value, the less susceptible the material is to deformation.
It is proved by the mechanics of materials that the positive elastic modulus and shear elastic modulus of isotropic bodies are related as follows:
E=2G(1+ν) (2-3)
In the equation, ν- Poisson ratio. It represents the proportional relationship between longitudinal and transverse deformation of a material. The ν value is generally between 1/4 and 1/3.
(2) Resistance to slope strain
Under the action of alternating stress, the phenomenon of spring material fracture is called fatigue fracture, and the stress value is much lower than the tensile strength. There is no obvious plastic deformation before the fatigue fracture, and the appearance of the fracture is usually divided into smooth region and coarse grain region (see Figure 8-7).
The main index to measure the fatigue resistance of the material is the fatigue limit, its physical meaning is: under the condition of alternating load, the material can withstand infinite stress cycles without being destroyed.
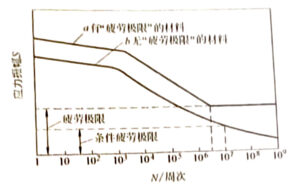
The basic method to provide fatigue performance in engineering is usually to obtain the fatigue curve (S-N curve) of metal materials by test, that is, to establish the measured relationship curve between the stress amplitude S and the corresponding fracture cycle N, as shown in Figure 2-1.
The fatigue limit is different when the type of stress (such as repeated bending, tension, repeated torsion or compound stress) is different. The fatigue phenomenon of materials has the following rules.
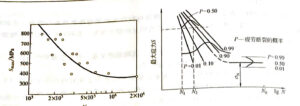
1) The higher the maximum value of variable stress the workpiece can bear, the smaller the stress cycle N before fracture; The lower the maximum stress, the greater the stress cycle N before fracture. Under certain conditions, when the maximum stress is lower than a certain value, the material can withstand infinite stress cycles without fracture. Figure 2-2a shows the relationship between cyclic stress and cycle times of failure, i.e. the fatigue curve (S-N curve). It can be clearly seen from the curve that when the maximum stress is lower than a certain value, the curve is gradually parallel to the horizontal coordinate and becomes a fixed value, and the stress value at this time is the fatigue limit

Figure 2-1 Fatigue pole curve of metal materials
2) Practice has proved that the fatigue curve of most steel materials becomes horizontal after 107 cycles, while the fatigue curve of non-ferrous metals and some ultra-high strength steels has no obvious horizontal part, and the fatigue limit can be determined conditionally after 108 or more weeks of stress cycles. For convenience, a finite value is often specified according to actual needs (generally 5×10⁷ or 108 times), and the maximum stress that exceeds this finite value without breaking is called the conditional fatigue limit of the material
3) For materials subjected to positive and negative cyclic stress, under the premise of the same maximum stress, symmetrical stress cycling will cause more damage to the material than asymmetric stress cycling. When the stress is asymmetrical cycle, if the maximum stress is the same, the greater the degree of stress cycle asymmetry, the more stress cycles the specimen will undergo before fracture, that is, the smaller the damage to the material
4) Although different materials have the same fatigue limit, the left and right positions and tilt angles of the oblique part of the fatigue curve may be different. This indicates that the resistance of the material to fatigue overloading (the load when the stress exceeds the fatigue limit) is different. The stress level at each point of the inclined part of the fatigue curve and the corresponding cycle times are called overload endurance value or fatigue strength of finite cycles. When evaluating the fatigue resistance of a material comprehensively, there should be a complete fatigue curve.
5) The fatigue curve of the material is determined by experiment, and the dispersion of the experimental data is very large. Strictly speaking, the S-N curve is actually a curve band, as shown in Figure 2-2b. Therefore, the fatigue curve should be regarded as the mean of a set of dispersion bands obtained from the test. When there are enough fatigue data, a set of fatigue curves with different failure probabilities can be drawn using probabilistic statistics, that is, P-S-N curves, where P represents the fatigue failure probability. The S-N curve usually plotted is equivalent to a PS-N curve with a probability of failure P=50%.
6) There are many factors affecting the fatigue performance, in addition to the material itself, the production process of the parts, the use of the environment, etc., have different effects. Therefore, for some important parts, fatigue tests need to be carried out when setting.

Figure 2-2 Statistical diagram of fatigue curve
(3) Strength
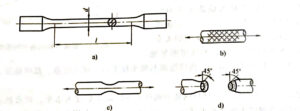
Tensile test is often used to test the mechanical properties of metal materials, and the strength and plasticity of materials can be reflected by the data of tensile test. Figure 2-3a shows the standard tensile sample of low carbon steel (GB/T228,M0DS06892).

Figure 2-3 Schematic diagram of standard tensile specimen and failure form
a) Standard tensile specimen of mild steel b)45° slip line c) necking d) fracture shape
1) Elastic stage:
As can be seen from the S-e figure, the strain value of the OB section of the curve is very small. If the load is removed, the deformation of the sample will all disappear, so it is called elastic deformation, and this stage is called elastic stage.
The elastic stage is divided into two parts: the OA part of the inclined line and the AB part of the micro-bending section. The oblique line OA indicates that the stress and stress change are proportional, that is, the material obees Hooke’s law. The stress corresponding to the highest point of the line, A, is called the proportional limit, and it is the maximum stress value that can be generated when the material is subject to Hooke’s law. According to Hooke’s law, the ratio of stress to strain on the oblique line O4 is the elastic modulus E, i.e
E=σp/ε =tanα
When the deformation is very small, the engineering stress S and the true stress σ and the engineering strain e and the direct strain e are very close, so the equation (2-4) can be used in the engineering calculation:
E=σ/e (2-4)
The shear modulus G can be converted from the elastic modulus E, i.e
G=E/[2(1+ν) (2-5)
Where ν to Poisson ratio, steel ν=0.3.
When the stress exceeds the proportional limit but is still less than the stress value at point B on the figure, section AB is no longer a straight line, and the strain of the material is no longer subject to Hooke’s law, but if the stress is discharged at this time, the deformation can still completely disappear. The stress value corresponding to point B is the maximum stress in the elastic deformation stage, which is called the elastic limit. The elastic limit and the proportional limit have different meanings, but the values are very close, so they are usually not distinguished.
2) Yield stage:
When the stress exceeds point B, the S-e curve gradually curves, and after reaching point C, a horizontal wave line CD appears on the graph, indicating that the stress at this stage only fluctuates slightly, while the strain increases sharply, as if the material has lost its resistance to deformation. This phenomenon is called material yield.
The starting point of the yield stage is point C on the S-e curve, and the stress value at this point is the highest stress value in the yield stage, so point C is also called the upper yield point. Commonly referred to as the yield strength Rel(σa) refers to the minimum stress value of the yield stage, also known as the lower yield point, which represents the ability of the material to resist the yield, is an important indicator to measure the mechanical properties of materials. If the stress of the spring reaches this level, it will lose stiffness.
3) Strengthening stage:
at the stage from the yield termination point D to the highest point E on the S-e curve, the deformation of the material increases with the increase of stress, and the deformation does not increase if the stress is not increased. When the material continues to deform, the external force must be increased, this phenomenon is called strain strengthening of the material, also known as work hardening, so it is called this stage of strengthening. At the same time, because the neck has not yet appeared, it is also called the uniform deformation stage. The deformation at this stage is different from the deformation at the elastic stage and is an unrecoverable plastic deformation. The stress corresponding to point E is called the strength limit, that is, the tensile limit Rm(σb), which is the maximum stress value of the material that completely loses the bearing capacity, and is an important performance indicator of the spring material. Commonly referred to as tensile strength refers to this parameter.
4) Necking stage:
Before point E, the deformation of the sample in the range of standard distance L is uniform elongation along the axis and uniform contraction along the radial. Starting from point E, the deformation of the sample is concentrated within a certain local length, where the cross-sectional area begins to decrease (Figure 2-3), and the so-called “necking” phenomenon appears. Due to the continuous reduction of the cross-sectional area at the reduced diameter, although the stress at the neck position of the sample continues to increase, the tension required for continued deformation gradually decreases, and the engineering stress S value calculated according to the original cross-sectional area decreases accordingly until the curve is extended to point F, and the sample is pulled off.
When the specimen is broken after the above stages, one end of the fracture is cup-shaped and the other end is truncated cone, as shown in Figure 2-3d.
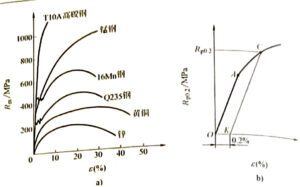
With the exception of mild carbon steel, the S-e curve for many materials has no obvious yield phase (Figure 2-5a). For these materials, the stress value of the sample when it produces a certain plastic deformation is specified as the representative value of the yield strength in engineering (Figure 2-5b), which is called the specified plastic extension strength R. For example, when the stress value at 0.2% plastic deformation represents the yield strength, it is denoted as Rp0.2(σ0.2).
Corresponding to the spring material, because of the high strength, there is no obvious yield stage.
(4) Plasticity
After the plastic sample is broken, the elastic part of the deformation disappears, while the plastic part remains, which is called residual deformation. In engineering, residual deformation is used to indicate plastic properties. Commonly used plasticity indicators are as follows.
1) Elongation A
A=(Lu-Lo)/Lo×100%
In the formula, Lo is the original standard distance of the specimen;
Lu– distance after specimen break.
2) Section shrinkage Z
Z=[(So-Su)/So]×100%
The initial transverse section of the So specimen in the formula
Su Cross sectional area of the fracture after fracture.

Figure 2-5 Schematic diagram of plastic extension strength Rp0.2
Both A and Z indicate the maximum degree of plastic deformation a material can achieve until it breaks. The larger the A and Z, the better the plasticity of the material, and vice versa, the worse the plasticity of the material. Generally good plastic materials, forming process is good, but the strength is low, fatigue strength is also low. Therefore, when choosing spring materials, it is necessary to choose the appropriate plastic material in terms of application and process.
(5) Hardness
Hardness is the most easily obtained mechanical properties test and thus the most widely used performance index. There are several methods of convenience test, including pressing method, characterization method, rebound method and so on. It can be generally believed that hardness is a measure of the resistance of the local surface of the material to the deformation caused by external forces, which reflects the ability to resist elastic deformation, plastic deformation or damage in the local scope of the material. The commonly used hardness test indexes of spring materials are Rockwell hardness, Brinell hardness and Vickers hardness, etc., and there are special testing instruments and operating methods. Their test principle belongs to the static load pressure method, the test uses a hard indenter, presses into the surface of the material with a certain force, maintains a certain time after unloading, and then converts the size of the indentation into the corresponding hardness.
1) Rockwell hardness HR: Rockwell hardness testing method is simple to operate, the measurement of hardness range is large, the indentation area is small, the surface damage of the sample is small, often directly used for testing finished products or thin specimens. However, due to the small indentation area of the detection method, the measured results of the material with uneven internal structure or hardness are large, so it is stipulated that the average of three points should be measured at different parts of the sample.
The Rockwell hardness test execution standard is GB/T230 “Rockwell Hardness Test of Metal materials” (series).
Rockwell hardness testing method is divided into A, B, C, D, E, F, G, H, K, N, T and other scales according to the type of indenter and the size of the total test force. Commonly used scales are A, B, C, and the corresponding hardness symbols are HRA, HRB, HRC
①HRA:120° diamond conical indenter, total test force 588.4N, suitable for detection range of 20~88HRA, such as carbide, surface quenched workpiece, carburized steel and so on. Example expression method: 50HRA, indicating that the Rockwell hardness value measured by the A scale is 50
②HRB: diameter of 1.5875mm cemented carbide (W) or hardened steel (S) spherical indenter, total test force 980.7N, suitable for detection range of 20~100HRB, such as non-ferrous metals, annealed steel, etc. Example representation: 50HRBW, indicating a Rockwell hardness value of 50 measured with a cemented carbide spherical indenter and a B scale.
RC120 diamond round dimensional indenter, total test force 1471N, suitable for detection range of 20-70HRC, such as quenched steel, tempered steel, etc., the most widely used, spring material township. Example representation method: 50HRC, indicating that the Rockwell hardness value measured by the C scale is 50. This method is commonly used for springs.
2) Vickers hardness HV: Vickers hardness testing method test pressure is small, shallow indentation, clear outline, easy to accurately measure, so widely used in metal coating, sheet material and chemical treatment of surface hardness. And because the test pressure can be selected in a wide range, it can be measured from very soft to very hard materials. However, Vickers hardness testing method is not as simple and rapid as Rockwell hardness testing method, and is not suitable for routine testing in batch production.
Vickers hardness test, the execution standard is GB/T4340 “Vickers Hardness Test of Metal materials”. 3) Brinell hardness BV: Brinell hardness testing method has a large indentation area, which can reflect the average hardness of the material in a large range, but the operation is not simple enough; Because of the large indentation, it is not suitable to detect the specimen with a small area. The Brinell hardness testing method is suitable for the detection of materials with a hardness value less than 650HBW.
Brinell hardness test GB/T231 “Metal material Brinell hardness test” (series), GB/ T231.1-2009 only allows the use of cemented carbide ball indenter, Brinell hardness symbol is HBV, should not be confused with the previous symbol HB and the symbol HBS used when using steel ball head.
Examples of Brinell hardness symbols: 600HBW1/30/20 indicates a Brinell hardness value of 600 measured by a cemented carbide ball with a diameter of 1mm held for 20 seconds under a test force of 294.2N(30kgf).
The mechanical properties of the spring material are crucial to the quality of the spring, and are one of the main factors affecting its strength and life. To customize the spring, it is necessary to find out the use of the spring environment and its required mechanical properties to choose the appropriate material.


